
Overview
Custom Finance and Operations Dashboards
Bridge the gap between financial data and operational execution with unified internal tools and real-time analytics designed for scale.
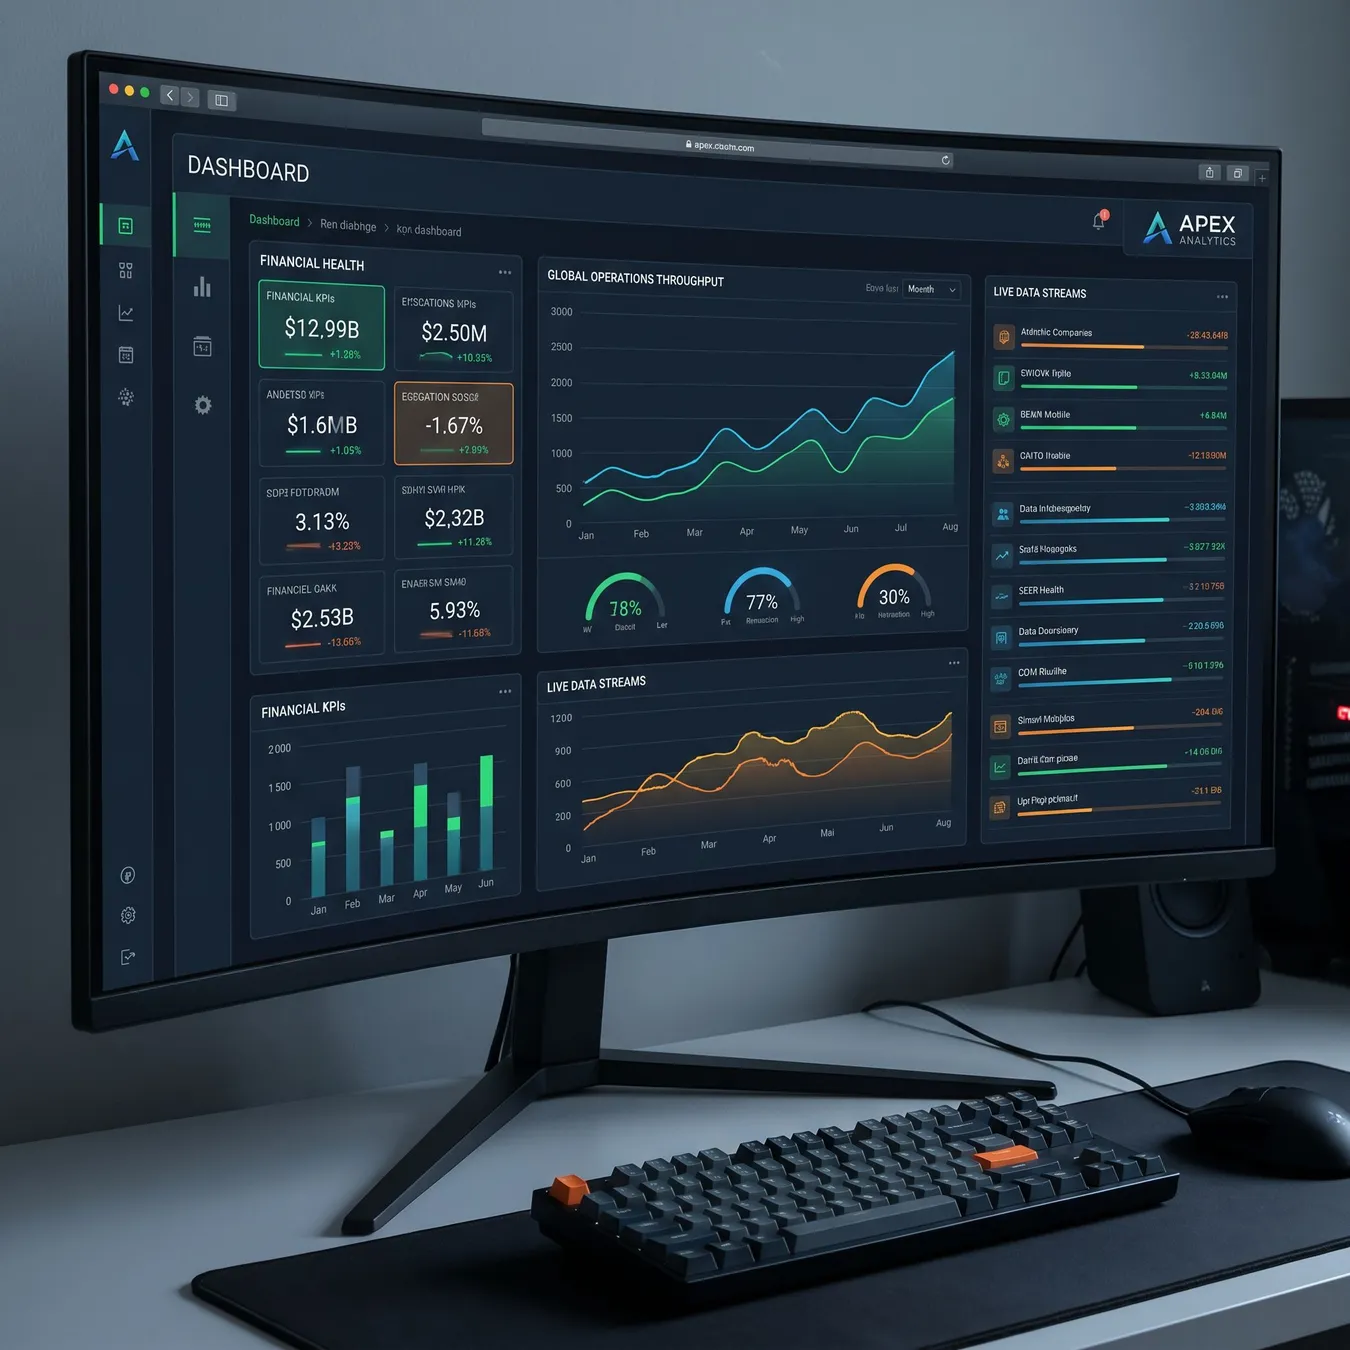
Unified Dashboard for Finance and Operations
Modern businesses often struggle with fragmented data silos where financial records and operational metrics live in separate worlds. A custom dashboard finance and operations solution eliminates this friction by centralizing KPIs into a single, actionable interface.
By integrating these streams, teams can move beyond static monthly reports and embrace finance and operations analytics that reflect the current state of the business. This real-time visibility is essential for high-growth companies managing complex supply chains or high-volume transactions.
85%
Reduction in manual data consolidation
Real-time
Sync between ERP and Ops tools
100%
Auditability for all financial events
The Core Benefits of Integrated Financial Dashboards
- Eliminate manual spreadsheet exports and fragile VLOOKUP dependencies.
- Identify operational bottlenecks before they impact the bottom line.
- Enable cross-departmental accountability with shared data truths.
- Accelerate month-end closing by automating data reconciliation.
- Improve forecasting accuracy with historical operational trends.
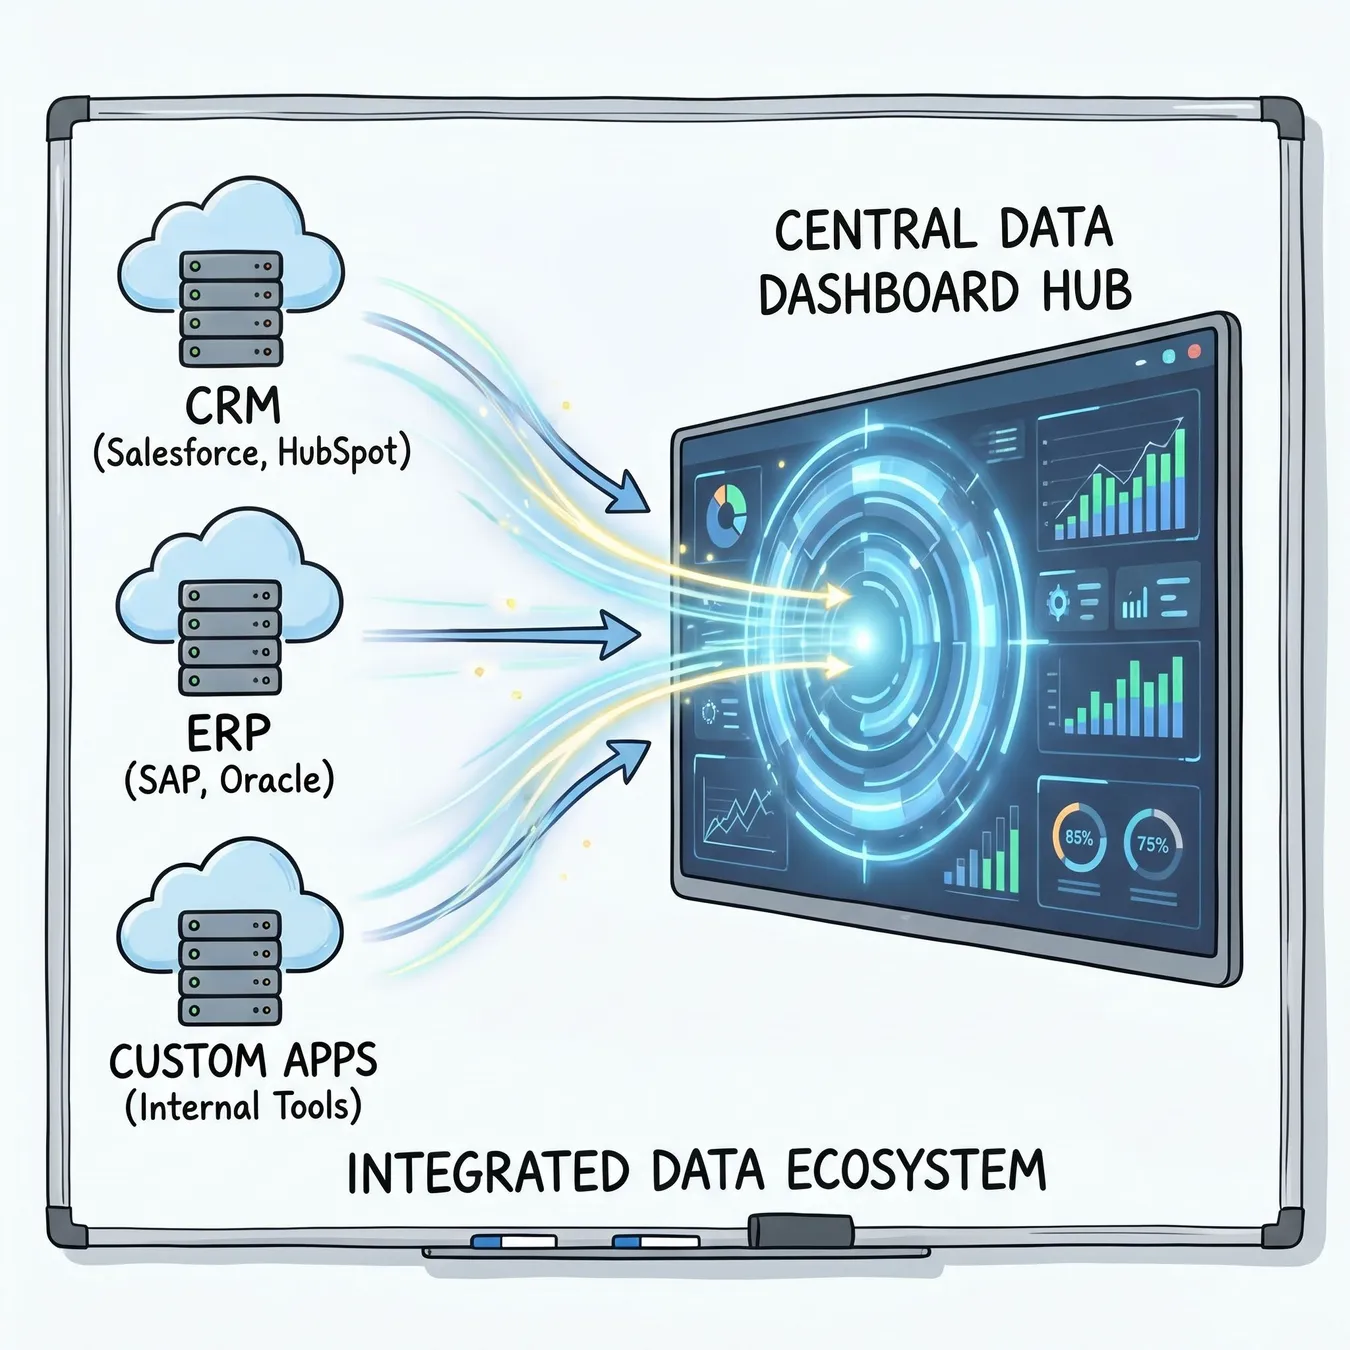
Breaking down silos through data orchestration.
Bridging the Gap: Finance and Operations Analytics
True operational intelligence requires more than just a chart; it requires context. When you build custom financial operations software, you aren't just looking at revenue; you're looking at the cost of goods sold in relation to real-time inventory levels and labor efficiency.
Info.
// Why Generic BI Tools Fail
Key Features of a Production-Grade Dashboard
| Feature | Impact | User Group |
|---|---|---|
| Real-time Sync | Zero latency reporting | Leadership |
| Role-based Access | Secure data isolation | Compliance/HR |
| Write-back Actions | Update ERP from dashboard | Ops Managers |
| Automated Alerts | Proactive risk management | Finance Team |
How We Build Custom Analytics Systems
Our approach focuses on durability and scale. We don't just build a visual layer; we engineer the underlying data pipelines that ensure your dashboard remains accurate even as your transaction volume grows.
01 / 04
phase 01 / 04
Discovery & Audit
phase 02 / 04
Architecture Design
phase 03 / 04
Custom Build
phase 04 / 04
Hardening & Launch
Common Dashboard Use Cases
Inventory and COGS Tracking
Monitor stock levels in real-time and automatically calculate the financial impact of supply chain delays or price fluctuations.
Revenue Operations & Pipeline
Connect sales activity directly to cash flow projections, allowing finance teams to see the immediate impact of closed-won deals on operational capacity.
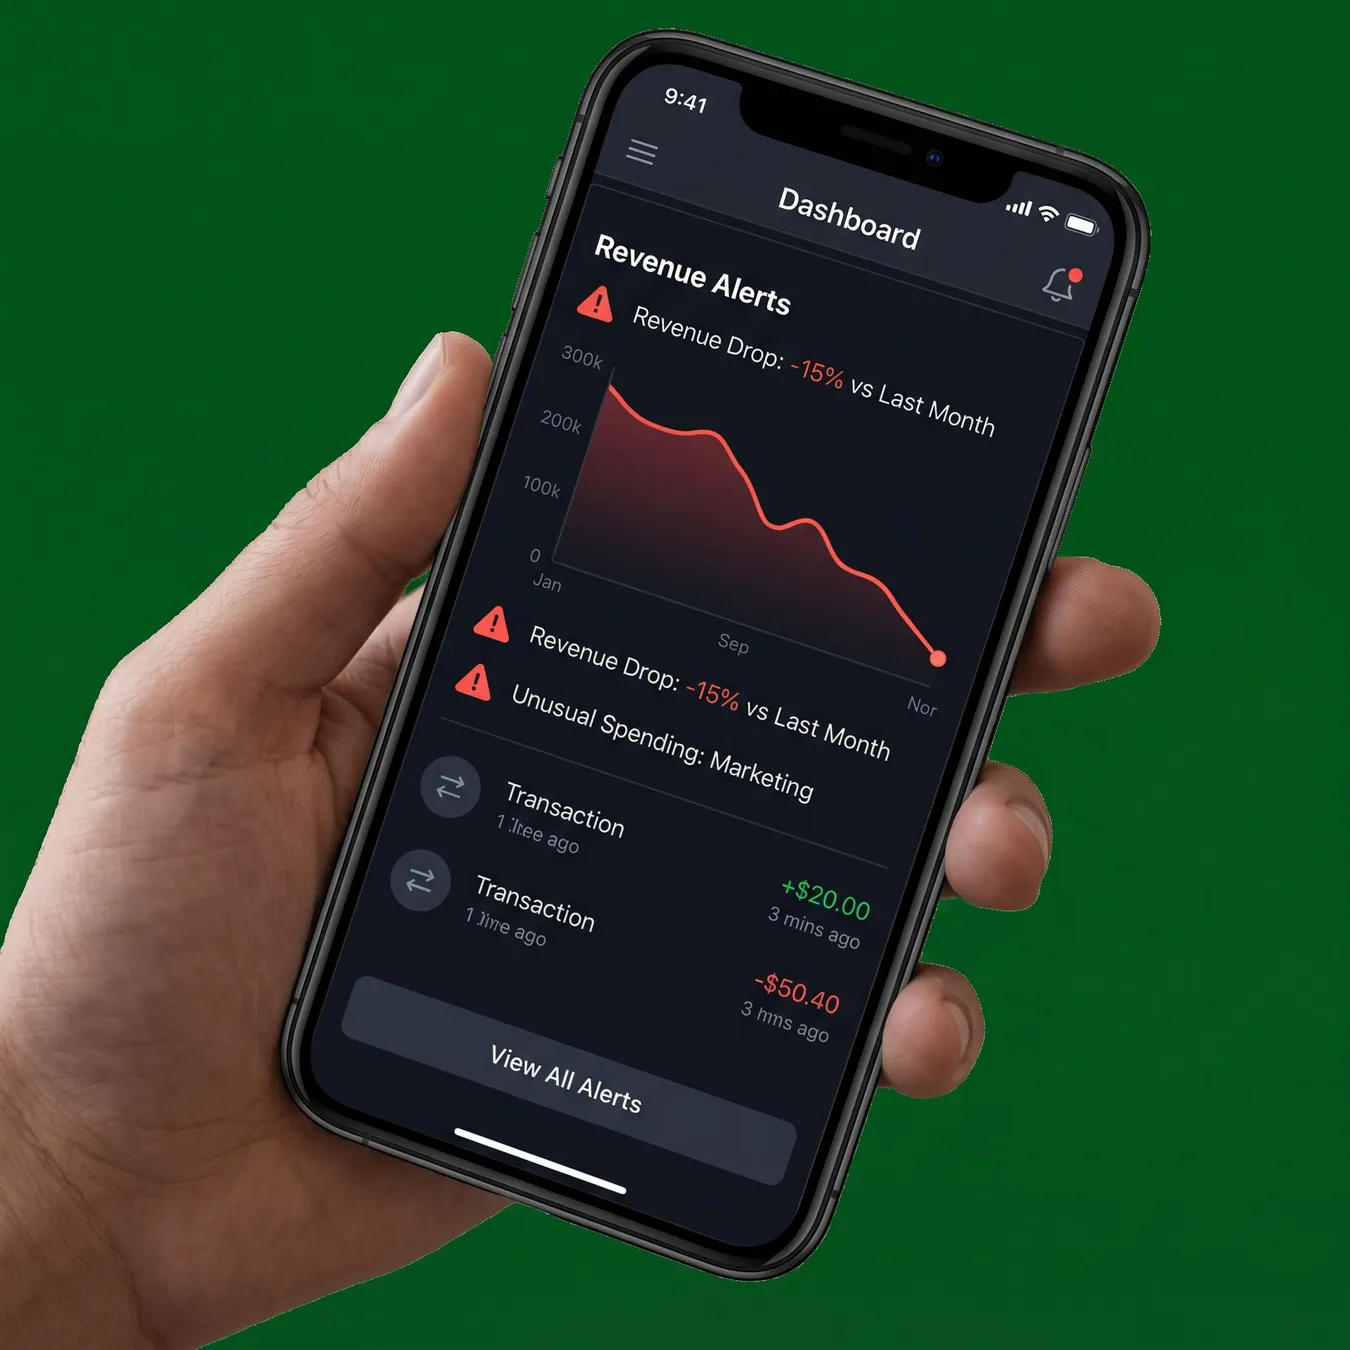
Mobile-responsive analytics.
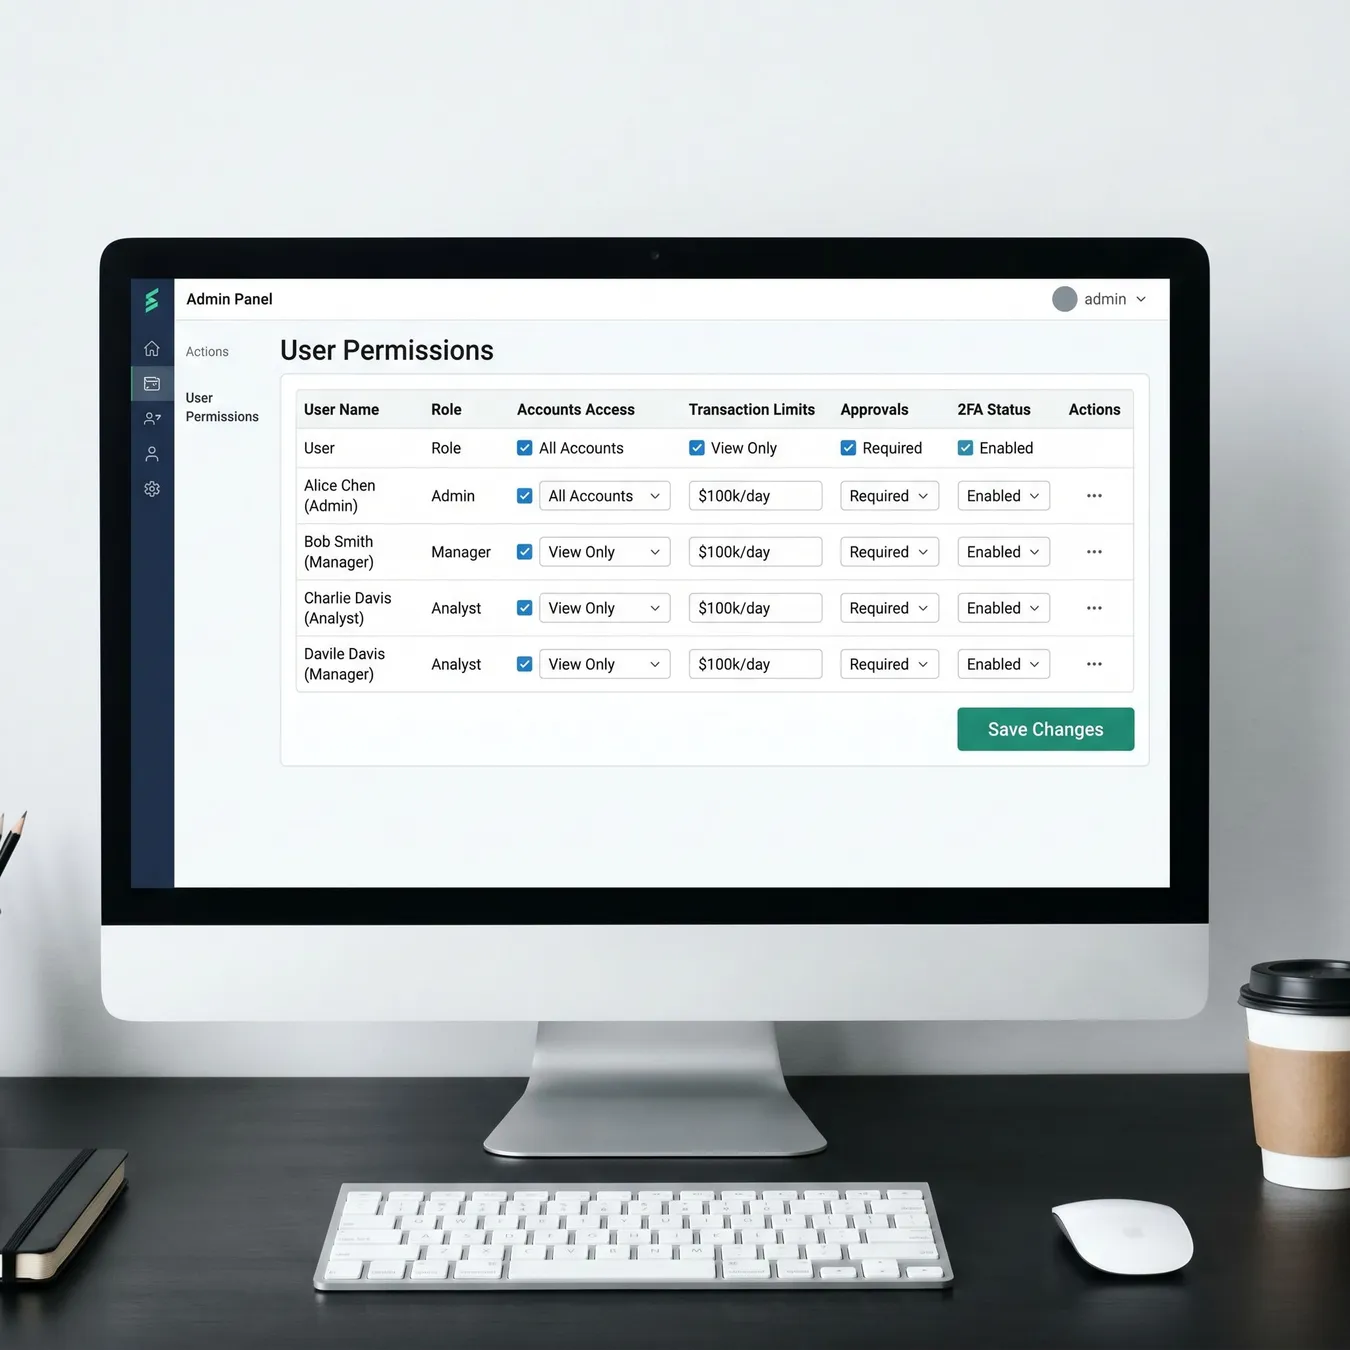
Granular security controls.
The Role of AI in Modern Dashboards
Dashboards are evolving from passive displays to active participants. By integrating agentic ai in finance, your dashboard can proactively flag anomalies or suggest budget reallocations based on operational trends.
Prioritize data accuracy over visual flair.
Implement granular role-based access controls.
Build for mobile-first accessibility for executives.
Ensure clear documentation for all data transformations.
Overload a single screen with too many metrics.
Use static exports that go out of date instantly.
Ignore the security of the underlying data pipeline.
Build without a clear path for future integrations.
Replacing Fragile Spreadsheet Workflows
Many teams rely on 'vibe-coded' or freelancer-built tools that break as soon as the business scales. We specialize in rescuing these systems and rebuilding them into durable, production-ready software.
The transition from manual spreadsheets to a unified dashboard was the single biggest driver of our operational efficiency this year.
Sarah Jenkins · Director of Finance
Technical Considerations for Scale
Multi-tenant architecture for departmental isolation
SOC2-compliant data handling and encryption
API-first design for easy third-party connectivity
Automated daily backups and disaster recovery
Why Studio 402 for Your Finance Dashboards?
We aren't just a dev shop; we are a product engineering studio. We understand that a dashboard is only as good as the business logic it supports. Whether you are building from scratch or rescuing a broken prototype, we ensure your systems are built for real-world use.
Trusted by growth-stage startups and mid-market operators to build durable financial infrastructure.
From MVPs to enterprise-grade internal tools.
Frequently Asked Questions
Ready to unify your finance and operations?
Stop fighting with spreadsheets and start leading with data. Let's build a dashboard that scales with your business.
Keep reading